The Carbon Cost of Flight-Heavy Itineraries: A 2026 Honest Look
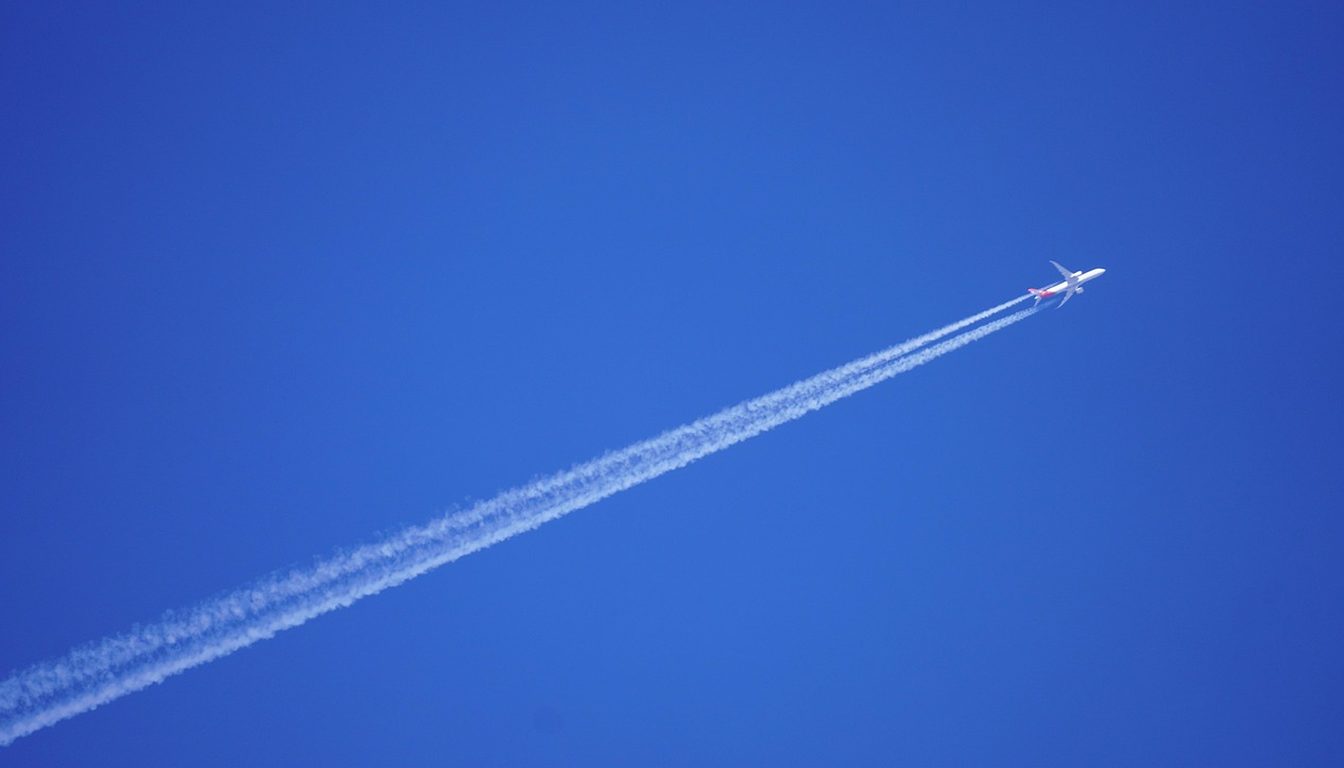
As the EU phases out free carbon allowances for airlines and proposes pricing international flight emissions from 2029, travelers face a new reality: flight-heavy itineraries carry a measurable climate cost that policy and public awareness are bringing into sharper focus. Here’s what changed in 2026 and why it matters for how you book your next trip.
An intra-EU flight that cost €80 five years ago now carries roughly €7 in visible carbon cost, and that gap widens in 2029 when international routes follow. Tickets will get more expensive. You’ll have to choose: pay more, fly less, or take the train instead.
Aviation’s True Climate Footprint in 2026
Aviation is responsible for about 2–3% of global CO2 emissions, with a larger total climate impact when non-CO2 effects at altitude are included. That modest-sounding percentage masks a more complex reality.
At cruising altitude, aircraft produce contrails, nitrogen oxides, and other agents that amplify warming in ways surface emissions do not. Standardized emission calculators now apply a radiative forcing index of about 1.9 to reflect these altitude effects, meaning the full warming impact of a flight can be nearly double its CO2 emissions alone.
This gap explains why frequent flyers carry outsized climate responsibility despite aviation’s modest global share. The sector’s footprint is concentrated: a minority of travelers take the majority of flights, making itinerary design choices highly consequential for individual and collective impact.
You need this multiplier to know your actual climate cost. A long-haul return in economy hits two tons CO2e. Two segments? You’re at four tons. Most travelers have no idea. That’s the problem.
The European Commission’s climate action framework acknowledges this complexity and has introduced measures to address both CO2 and non-CO2 aviation impacts within its policy architecture.
How the EU Emissions Trading System Is Tightening in 2026
Within the EU Emissions Trading System, free carbon allowances for airlines are being phased out by 2026.
From then on, every tonne of CO2 costs money. Airlines will pass that cost to you. Under current EU ETS rules, average carbon costs added to intra-EU flight tickets are about €7 per passenger, while international routes currently pay nothing because flights outside the EU are not yet covered. Airlines pass these costs through to passengers in different ways—some as visible surcharges, others absorbed into base fares—but the direction is consistent: the era of unpriced aviation emissions within Europe is ending.
Looking ahead, the European Commission has proposed extending the EU carbon market so that international flights arriving in Europe from destinations within 5,000 km will have to pay for their CO2 emissions from 2029. If adopted, this reform would bring a significant share of medium- and long-haul routes into the carbon pricing system for the first time, affecting transatlantic, North African, Middle Eastern, and other international connections.
The Transport & Environment analysis of the ETS trajectory shows how the carbon price will influence ticket costs and route economics as full auctioning takes hold.
Emission Factors by Route Type and Cabin Class
DEFRA- and ICAO-based emission factors with radiative forcing show per-passenger-kilometre footprints of about 0.12786 kg CO2e for short-haul economy flights, 0.15282 kg CO2e for long-haul economy, and 0.22928 kg CO2e for domestic economy, when non-CO2 effects are included. These figures serve as the foundation for most standardized carbon calculators and allow for consistent comparison across routes and itineraries.
Business class takes up three times the space per person. So your seat burns three times the fuel. Simple physics. First class can push this multiplier even higher, meaning that premium cabin choices on the same route can triple or quadruple an individual’s carbon footprint relative to economy.
These differences are not marginal. A single long-haul business-class return blows past the annual per-capita carbon budget for 1.5 °C. Think about that before you book. For travelers constructing itineraries with multiple segments in premium cabins, the cumulative climate cost can quickly surpass what many people emit from all other activities in a year.
A London-to-New York return in business class: 4.8 tonnes CO2e. Same flight, economy: 1.6 tonnes. That’s the kind of clarity the business travel air calculator gives you. For those planning a European grand tour or a complex multi-destination journey, comparing access options for individual legs can reveal where a rail alternative or cabin downgrade offers the greatest emission reduction.
Flight-Heavy vs. Lower-Carbon Itinerary Design
Mode choice is the deciding factor.
A week by train across Europe? 0.2 tonnes CO2e. Same week, three flights and business class? 5 tonnes. Your itinerary design is everything. Analyses show typical daily travel carbon footprints ranging from about 0.19 to 5.61 metric tonnes CO2e per passenger, with the upper end dominated by multiple flights, long-haul routes, and premium cabins.
Choosing direct flights rather than multiple connections reduces emissions because takeoff and landing are the most fuel-intensive phases; minimizing segments is an effective strategy for cutting the carbon cost of complex itineraries. Every extra flight segment means another takeoff and landing. Those burn fuel fast. So book direct when you can.
High-speed rail cuts emissions by 80–90% and dumps you in the city center instead of an airport 40 km away. It’s almost always the better choice in Europe. A Paris-to-Barcelona segment by TGV generates a fraction of the emissions of the equivalent flight, with the added benefit of city-centre to city-centre travel and no airport security delays. For travelers planning visits to landmarks such as Seine riverside attractions, integrating rail into the itinerary can preserve access while dramatically lowering climate cost.
High-speed rail cuts emissions by 80–90% and dumps you in the city center instead of an airport 40 km away.
For unavoidable air routes, flying economy on direct services and clustering destinations to reduce total flight legs offer the next most impactful levers for emission reduction. Fly economy, direct, and take trains between cities: 2 tonnes CO2e for a Europe tour. Same tour in business class with connections: 12 tonnes. That’s the difference.
Resources such as the Travel & Climate tool provide transparent comparisons across modes and routes, helping travelers design lower-carbon itineraries without sacrificing the richness of multi-destination exploration.
For a full multi-day plan in Paris, see Best things to do in Paris in 3 days: a curated itinerary.
Case Study: Air Travel to Climate Conferences
Nature researchers tracked delegate flights to UN climate conferences over three decades: 710,000 tonnes CO2e. The irony is sharp. Global cooperation on climate requires convening in person, yet the means of arrival—predominantly long-haul aviation—generates significant emissions that attract scrutiny and calls for hybrid or regional formats.
The data highlight that no sector or group is exempt from the carbon cost of flight-heavy schedules, and the visibility of these emissions has accelerated calls for virtual participation, regional hubs, and improved rail connectivity to host cities. If the climate policy community itself struggles with the trade-off between face-to-face negotiation and emissions reduction, leisure and business travelers face similar tensions in weighing the value of in-person experience against climate impact.
The lesson for leisure and business travelers alike is that cumulative flight emissions add up quickly across itineraries, conferences, and repeat trips, making each journey’s mode and routing a material climate decision. The COP case study also illustrates that transparency in emission accounting—publishing the carbon footprint of large-scale events—can drive behavior change and policy innovation, a model that applies equally to corporate travel programs and personal itinerary planning.
Practical Tools and Calculators for Travelers
Use a DEFRA-based calculator—they’re standardized and reliable. Input your flight details and you’ll see your real emissions in minutes.
Before booking a flight-heavy trip, using one of these tools to map expected emissions can identify where substituting trains, reducing segments, or choosing economy over business will cut the itinerary’s carbon cost most effectively. The process takes minutes and provides a concrete benchmark against which to evaluate trade-offs between convenience, cost, and climate responsibility. Corporate travel emissions dashboards and individual footprint tools have evolved to use standardized factors, enabling more consistent accounting and comparability across itineraries and travel policies.
These calculators use public data and clear math. You can trust the numbers. Use them to compare options before you book. When a flight carbon calculator shows that a business-class transatlantic return generates three times the emissions of the same journey in economy, or that a two-segment connecting flight produces 40% more CO2e than a direct service, travelers can weigh those figures against ticket prices, schedules, and comfort preferences.
Complementary resources such as rail journey planners and intermodal route finders help travelers design lower-carbon alternatives without sacrificing connectivity or experience. The combination of emission transparency and modal flexibility makes it possible to construct itineraries that meet practical constraints while staying within reasonable carbon budgets.
Common Myths About Flight Emissions
A 200 km flight burns more carbon than a train covering the same distance. Below 500 km, rail almost always wins. Above 1000 km, flying is your only option. The misconception that a one-hour flight is trivial in climate terms overlooks the energy required to lift an aircraft and its passengers to cruising altitude, which represents a disproportionate share of total fuel burn on short sectors.
Distance alone does not determine climate impact—cabin class, number of segments, and non-CO2 effects at altitude all influence total emissions, with business/first class and multi-connection itineraries significantly increasing the carbon cost compared to direct economy flights. Two passengers flying the same city pair can have wildly different footprints depending on whether they choose a direct economy service or a two-stop journey in business class. The compounding effect of these variables means that itinerary design matters as much as destination choice.
Aviation’s climate impact extends beyond its share of global CO2 emissions due to altitude effects, and policy frameworks such as the EU ETS are tightening precisely to address this sector’s specific warming contribution. The 2–3% global CO2 figure is often cited to downplay aviation’s role, but when radiative forcing is included, the sector’s share of anthropogenic warming is measurably higher. Policymakers recognize this distinction and are designing regulations accordingly.
From 2029, many international flights into Europe will be priced for carbon. Expect ticket prices to rise, maybe 10–15% on transatlantic routes. Plan accordingly. Travelers booking long-haul itineraries should anticipate that carbon costs will increasingly appear in ticket prices, reshaping the economics of international air travel in the same way the EU ETS has affected intra-European routes.
For a full multi-day plan in Rome, see First-time visitor’s guide to Rome in 4 days.
What Travelers Can Do in Practice
Prioritize direct economy flights on unavoidable air routes, since avoiding extra takeoffs and landings and choosing higher-density cabins can substantially lower per-person emissions on the same itinerary. This is the most accessible lever for most travelers: it requires no special infrastructure, no new technology, simply a preference for non-stop services and standard seating. The emission savings are immediate and quantifiable.
For multi-city journeys, design routes that cluster destinations geographically and consider rail or other transit links between nearby cities to reduce the number of separate flight legs and overall climate impact. A traveler visiting Madrid, Barcelona, and Paris might fly into Madrid, take high-speed trains to Barcelona and Paris, and fly home from Paris, rather than booking three separate flights. The result is a richer ground-level travel experience with a fraction of the emissions.
Use recognized emission calculators before booking to compare routing options, class choices, and modal alternatives, enabling evidence-based decisions rather than guesswork. The Sustainable Travel International calculator and similar tools provide per-trip estimates that can be benchmarked against personal or organizational carbon budgets, making abstract climate goals concrete and actionable.
Where feasible, replace short- to medium-haul flights with high-speed rail or overnight trains, capturing both emission savings and often a richer travel experience with city-centre to city-centre convenience. Sleeper trains, in particular, turn travel time into rest time while eliminating the emissions and hassle of airport transfers. For travelers who value the journey as part of the experience, rail substitution delivers multiple benefits beyond climate mitigation.
Sleeper trains, in particular, turn travel time into rest time while eliminating the emissions and hassle of airport transfers.
Understand that even modest changes—one fewer segment, economy instead of business, a train substitution—can cumulatively halve or more the carbon cost of a complex itinerary without requiring travelers to forgo exploration. The goal is not to eliminate travel but to make intentional choices that align with climate responsibility. The regulatory environment is evolving to support these decisions through pricing signals and infrastructure investment, but individual agency remains the critical variable in the near term.